

Linux is down slightly after a peak month, but probably that month had Linux over-represented. This month we see English down a bit too, Chinese is up a little.
https://store.steampowered.com/hwsurvey/Steam-Hardware-Software-Survey-Welcome-to-Steam
https://www.gamingonlinux.com/steam-tracker/
I copied the data from gamingonlinux and put it into my own sheet with an exponential trendline (red) and a moving average line (green) to smooth out the variance of the survey. We’re definitely trending upwards.
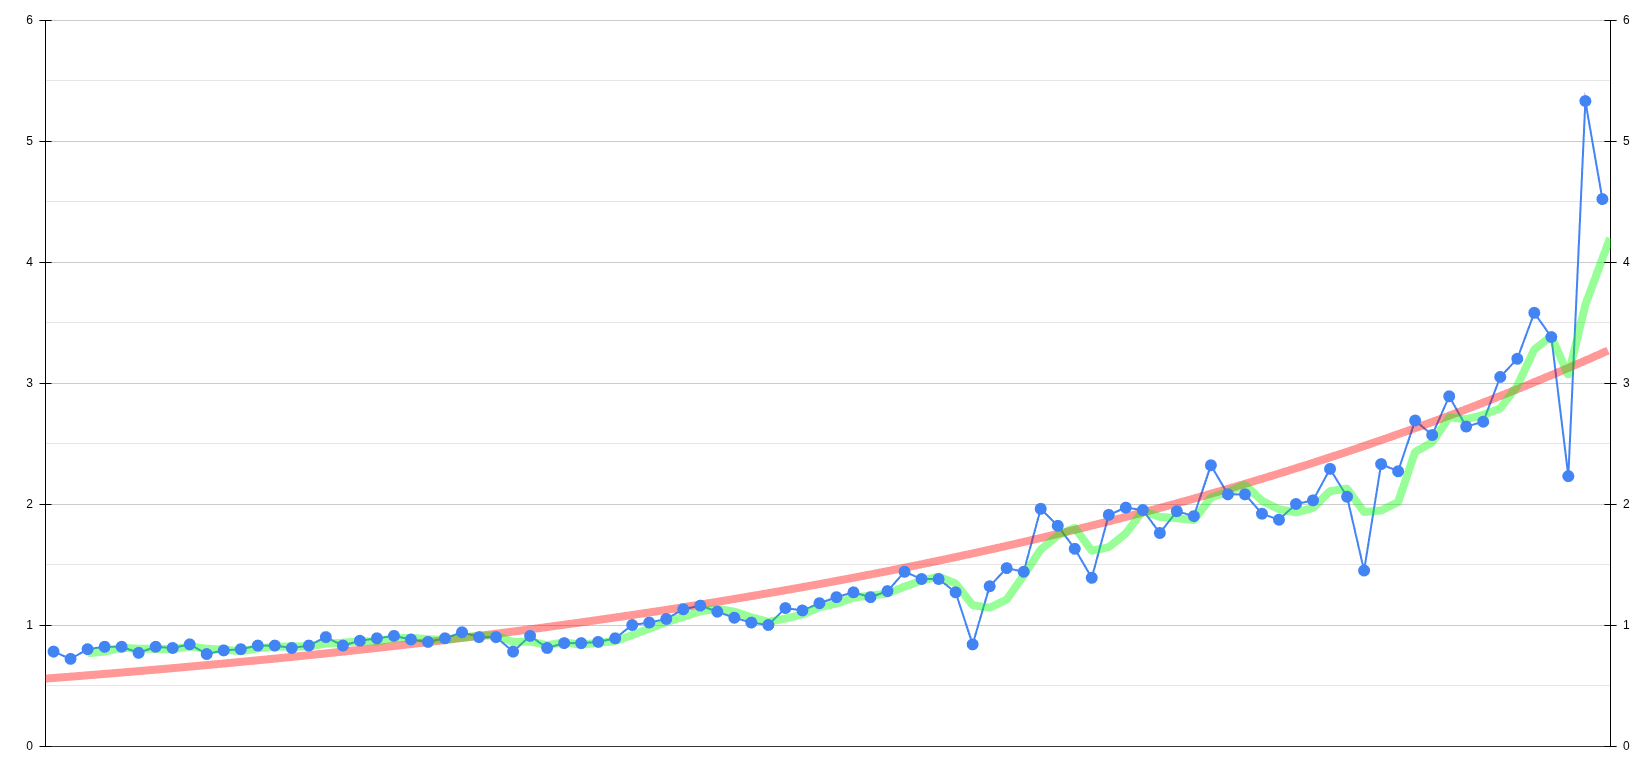
Here’s the csv data
0.78, 0.72, 0.80, 0.82, 0.82, 0.77, 0.82, 0.81, 0.84, 0.76, 0.79, 0.80, 0.83, 0.83, 0.81, 0.83, 0.90, 0.83, 0.87, 0.89, 0.91, 0.88, 0.86, 0.89, 0.94, 0.90, 0.90, 0.78, 0.91, 0.81, 0.85, 0.85, 0.86, 0.89, 1.00, 1.02, 1.05, 1.13, 1.16, 1.11, 1.06, 1.02, 1.00, 1.14, 1.12, 1.18, 1.23, 1.27, 1.23, 1.28, 1.44, 1.38, 1.38, 1.27, 0.84, 1.32, 1.47, 1.44, 1.96, 1.82, 1.63, 1.39, 1.91, 1.97, 1.95, 1.76, 1.94, 1.90, 2.32, 2.08, 2.08, 1.92, 1.87, 2.00, 2.03, 2.29, 2.06, 1.45, 2.33, 2.27, 2.69, 2.57, 2.89, 2.64, 2.68, 3.05, 3.20, 3.58, 3.38, 2.23, 5.33, 4.52
I like the chart and agree with the conclusion. But shouldn’t the exponential trend line start at the same percentage in the beginning of the chart? Right now, the exponential trend line is far below the original value at start, and with exponential lines that matters.
Might be a fitted to minimize the distance to all points. OP didn’t specify enough information though
It’s whatever Google Sheets does lol